 2020-04-29 / 2020-W18-3T13:45:00-05:00 / 0x5ea9cb2c
Introduction
The other day, I came across something called the "cube root rule", which is a proposed reform to the size of the U.S. House of Representative. Since 1913, the size of the U.S. House has remained constant at 435 seats (except for a few years when two seats were temporarily added to accommodate the addition of Alaska and Hawaii). Under the cube root rule, the size of the U.S. House would be increased to the cube root of the U.S. population (suitably rounded), adjusted every census. As I write this, the U.S. Census bureau estimates that the population is currently about 329.6 million, and so adopting the cube root rule would expand the U.S. House to 691 seats.
The cube root rule was first proposed by political scientist Rein Taagepera in a 1972 paper. In this paper, he examines the size of national legislative bodies and concludes that \(n = \sqrt[3]{P}\) is a reasonable for the size \(n\) of a nation's legislature as a function of population \(P\). Then he gives a theoretical argument for why \(\sqrt[3]{P}\) is an optimal value for \(n\).1
I do believe that we would benefit from having a larger U.S. House, for many of the reasons articulated by the New York Times in a 2018 editorial, and perhaps the Cube Root Rule would be a good way to accomplish that. However, the point of this post is not to make that argument, but rather, see what kind of models we can make for the actual observed sizes of legislative bodies.
Disclaimer
I want to be clear here that I don't think I'm doing anything novel here. I am pretty sure that many actual political scientists (which I am absolutely not) have tread this ground before. If I were writing an academic paper, rather than just messing around on my blog, I would do a proper literature review and put it here. This post is mostly about having fun programming than anything else.
Regression for all countries
In order to investigate this question, I needed a data set that contained the size of legislative bodies and populations for a number of countries. If I were a real political scientist, I would probably use some carefully curated data set from some international organization, but because I'm just some guy messing around on his blog, I turned to Wikipedia, namely the article "List of legislatures by number of members".2 Fortunately, Pandas has the capacity to scrape web pages and extract data frames from their tables.
For this analysis, I considered the size of the lower house of each legislature (in cases where the legislature has more than one chamber). Wikipedia's table doesn't just include sovereign nations, but also external territories of various degrees of autonomy (e.g. Puerto Rico and Hong Kong), as well as the European Union (which has an elected parliament). Note that countries are included even if their legislatures are not elected using what we would consider free and fair elections (such as North Korea).
I threw out countries where the size of the lower house was listed as "maximum" or "minimum" (because who knows what the actual size is). If it said "usually" or "normally", I used the number listed. For Timor-Leste it gave a range ("52 to 65"), so I took the midpoint.
I took the logarithm3 of the population and lower house size and performed a least-squares linear regression, obtaining: \[\log(n) = 0.3482\log(P) - 0.5369, ; r^2 = 0.8482.\] This corresponds to \(n = 0.5846P^{0.3482}\).
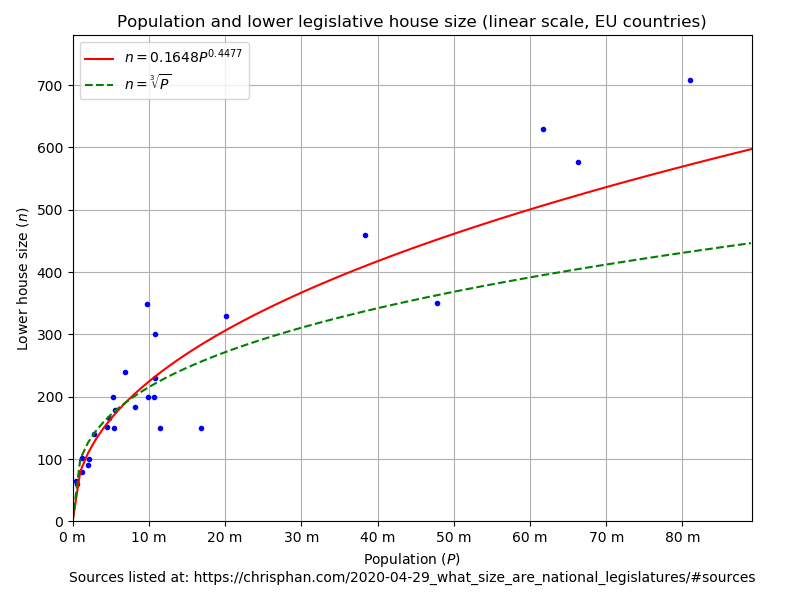
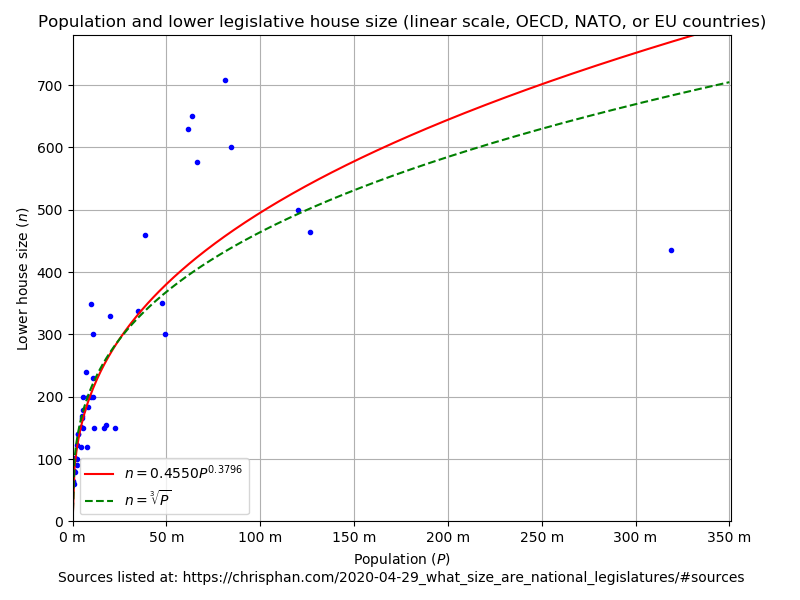
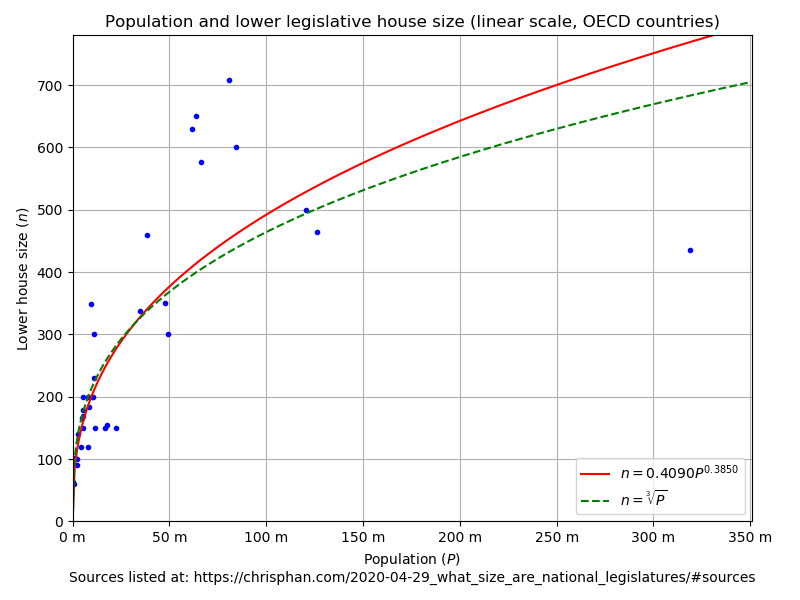
Here is a scatterplot of the data along with \(n = 0.5846P^{0.3482}\) and \(n = \sqrt[3]{P}\):
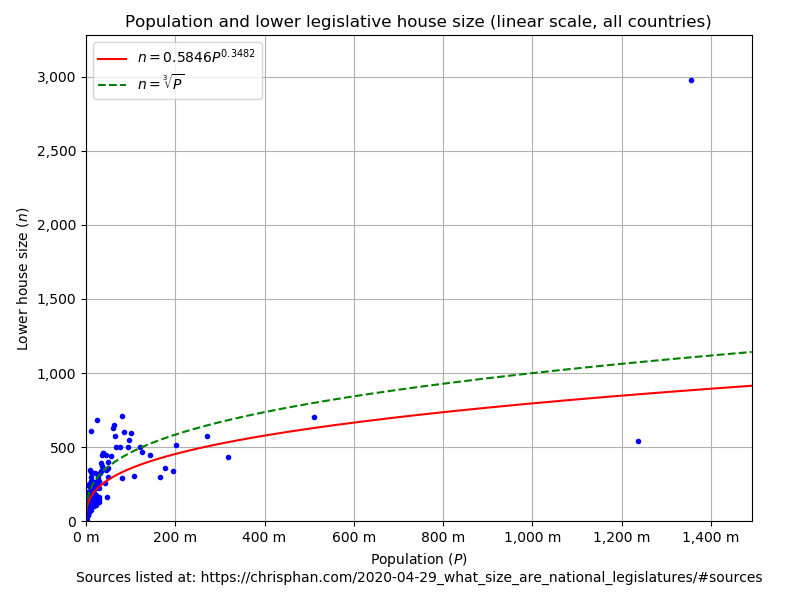
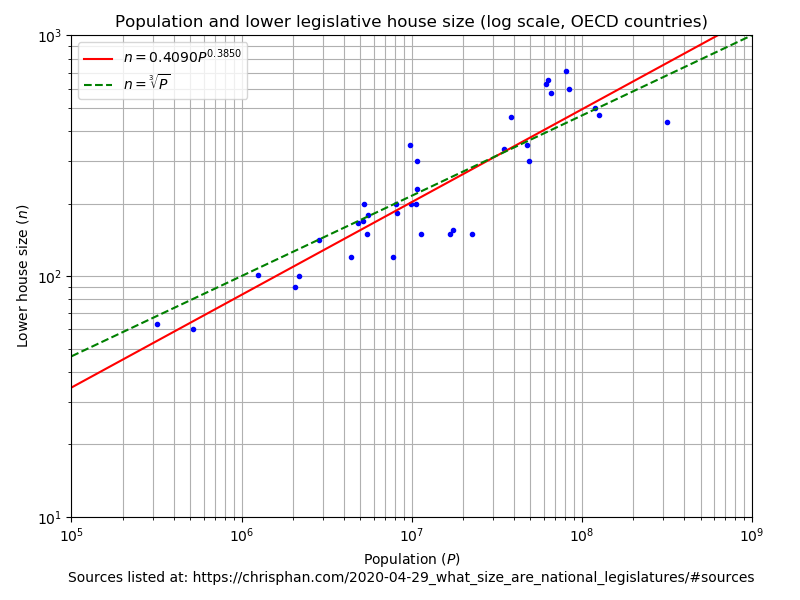
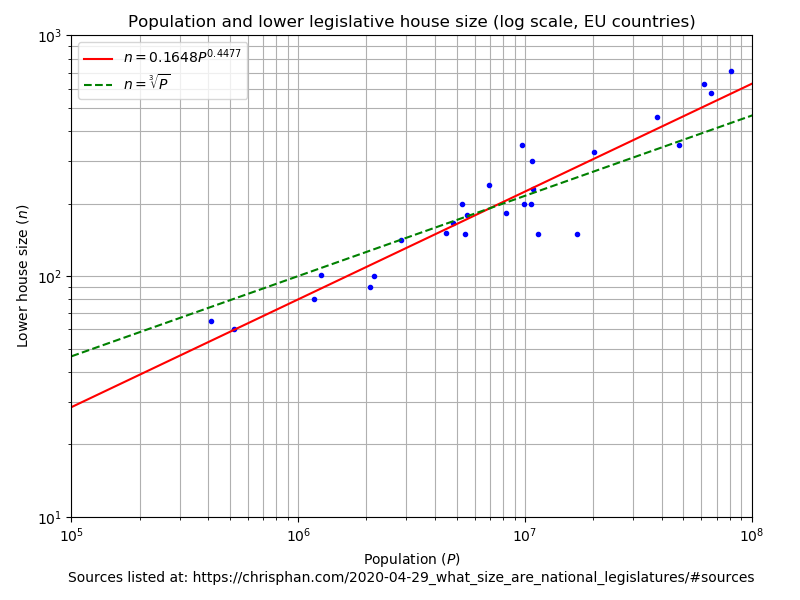
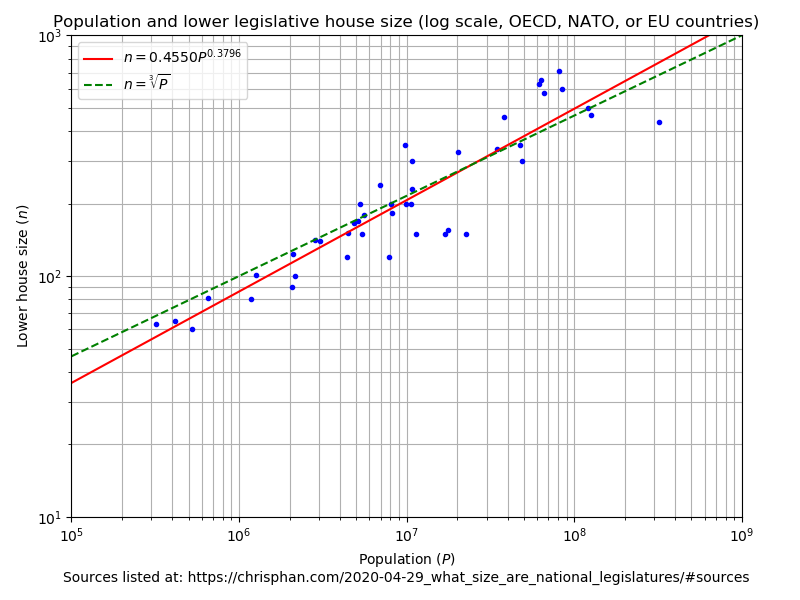
And here is the same, but plotted in log scale (which makes more sense for this data):
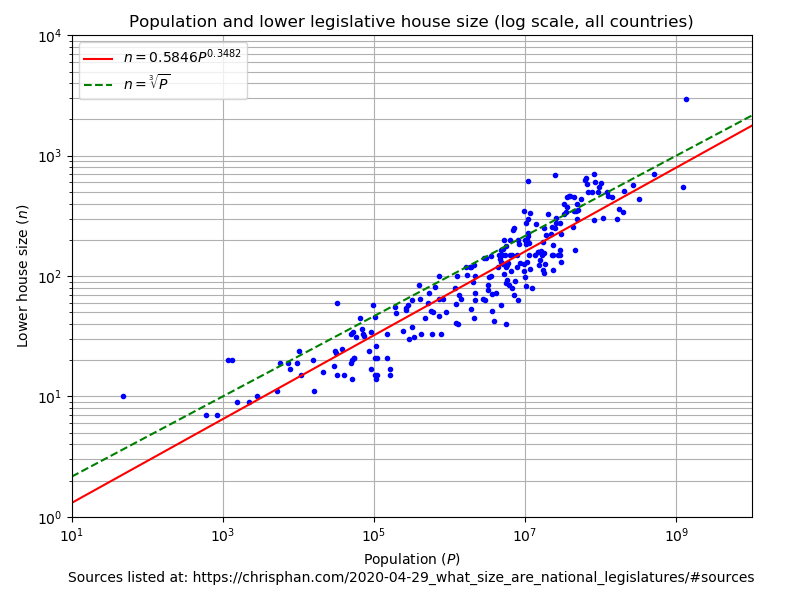
(It should be noted that a very similar plot appears in Taagepera's paper.)
Regression for other subsets of countries
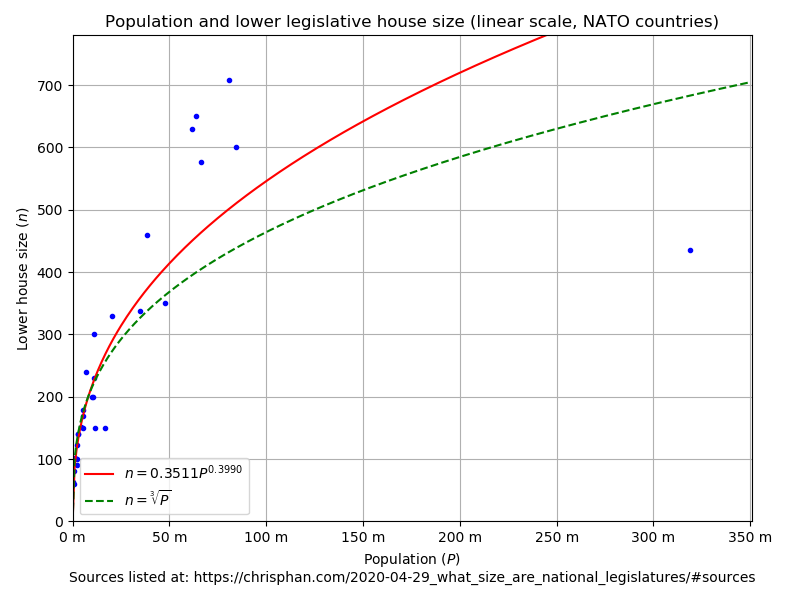
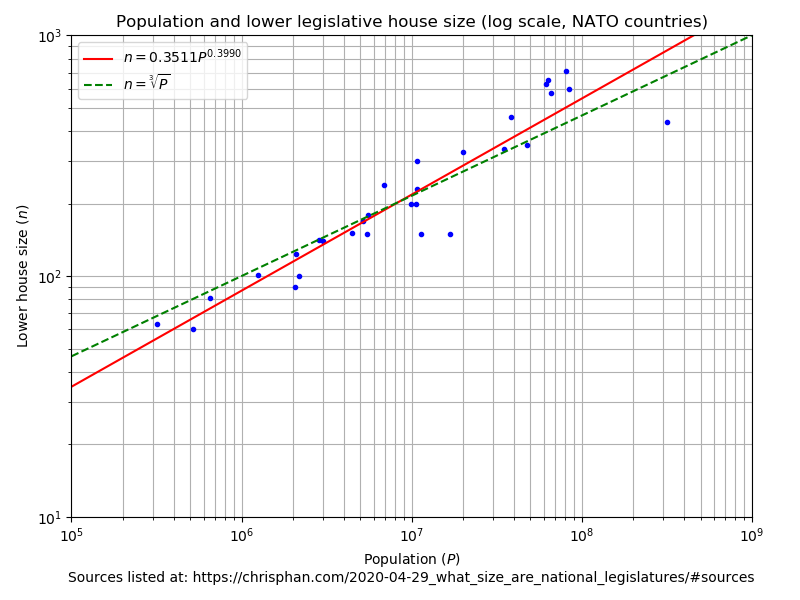
As mentioned before, the data set includes countries that are not democracies (e.g. North Korea) as well as non-countries (territories and the European Union). We might restrict our attention to various subsets of countries, such as the members of:
- The North Atlantic Treaty Organization
- The Organisation for Economic Co-operation and Development
- The European Union
The results are in this table:
| Group of countries | Regression4 | \(r^2\) | Plots |
|---|---|---|---|
| all | \(\log(n) = 0.3482\log(P) - 0.5369 \Rightarrow n = 0.5846P^{0.3482}\) | \(r^2 = 0.8482\) | linear log |
| NATO | \(\log(n) = 0.3990\log(P) - 1.0466 \Rightarrow n = 0.3511P^{0.3990}\) | \(r^2 = 0.8764\) | linear log |
| OECD | \(\log(n) = 0.3850\log(P) - 0.8940 \Rightarrow n = 0.4090P^{0.3850}\) | \(r^2 = 0.8026\) | linear log |
| EU | \(\log(n) = 0.4477\log(P) - 1.8032 \Rightarrow n = 0.1648P^{0.4477}\) | \(r^2 = 0.8817\) | linear log |
| OECD, NATO, or EU | \(\log(n) = 0.3796\log(P) - 0.7875 \Rightarrow n = 0.4550P^{0.3796}\) | \(r^2 = 0.8339\) | linear log |
For example, the aforementioned New York Times editorial has a plot similar to this one:
Source code
The Python script to parse the Wikipedia article, run the regressions, and produce the plots can be downloaded here: leg_sizes.py
It is also shown below:
1
2
3
4
5
6
7
8
9
10
11
12
13
14
15
16
17
18
19
20
21
22
23
24
25
26
27
28
29
30
31
32
33
34
35
36
37
38
39
40
41
42
43
44
45
46
47
48
49
50
51
52
53
54
55
56
57
58
59
60
61
62
63
64
65
66
67
68
69
70
71
72
73
74
75
76
77
78
79
80
81
82
83
84
85
86
87
88
89
90
91
92
93
94
95
96
97
98
99
100
101
102
103
104
105
106
107
108
109
110
111
112
113
114
115
116
117
118
119
120
121
122
123
124
125
126
127
128
129
130
131
132
133
134
135
136
137
138
139
140
141
142
143
144
145
146
147
148
149
150
151
152
153
154
155
156
157
158
159
160
161
162
163
164
165
166
167
168
169
170
171
172
173
174
175
176
177
178
179
180
181
182
183
184
185
186
187
188
189
190
191
192
193
194
195
196
197
198
199
200
201
202
203
204
205
206
207
208
209
210
211
212
213
214
215
216
217
218
219
220
221
222
223
224
225
226
227
228
229
230
231
232
233
234
235
236
237
238
239
240
241
242
243
244
245
246
247
248
249
250
251
252
253
254
255
256
257
258
259
260
261
262
263
264
265
266
267
268
269
270
271
272
273
274
275
276
277
278
279
280
281
282
283
284
285
286
287
288
289
290
291
292
293
294
295
296
297
298
299
300
301
302
303
304
305
306
307
308
309
310
311
312
313
314
315
#!/usr/bin/env python3

# leg_sizes.py
# Christopher Phan
# cphan@chrisphan.com
# https://chrisphan.com/
#
# Takes data from the Wikipedia article "List of legislatures by number of
# members", and peforms a linear regression on n = kP^alpha
# where n is the number of members of the lower house of a nation's legislature
# and P is the population.
#
# This script was written for Python 3.6.
#
# To run this script, save
# https://en.wikipedia.org/w/index.php?title=List_of_legislatures_by_number_of_members&oldid=951703531
# to legislatures.html
#
################################################################################
#
# Copyright 2020 Christopher Phan
#
# Permission is hereby granted, free of charge, to any person obtaining a copy
# of this software and associated documentation files (the "Software"), to deal
# in the Software without restriction, including without limitation the rights
# to use, copy, modify, merge, publish, distribute, sublicense, and/or sell
# copies of the Software, and to permit persons to whom the Software is
# furnished to do so, subject to the following conditions:
#
# The above copyright notice and this permission notice shall be included in all
# copies or substantial portions of the Software.
#
# THE SOFTWARE IS PROVIDED "AS IS", WITHOUT WARRANTY OF ANY KIND, EXPRESS OR
# IMPLIED, INCLUDING BUT NOT LIMITED TO THE WARRANTIES OF MERCHANTABILITY,
# FITNESS FOR A PARTICULAR PURPOSE AND NONINFRINGEMENT. IN NO EVENT SHALL THE
# AUTHORS OR COPYRIGHT HOLDERS BE LIABLE FOR ANY CLAIM, DAMAGES OR OTHER
# LIABILITY, WHETHER IN AN ACTION OF CONTRACT, TORT OR OTHERWISE, ARISING FROM,
# OUT OF OR IN CONNECTION WITH THE SOFTWARE OR THE USE OR OTHER DEALINGS IN THE
# SOFTWARE.
#

import pandas as pd
import scipy.stats as stats
import numpy as np
import matplotlib
import matplotlib.pyplot as plt

# See note above
data = pd.read_html("legislatures.html")[0]

def contains_min_or_max(x):
    if ("minimum" in x) or ("maximum" in x):
        return True
    else:
        return False

# Get rid of entries with only a minimum or maximum leg size listed
# (since we have no idea the actual size)
data = data[data["Lowerhouse[1]"].apply(contains_min_or_max) == False]

def number_parse(x):
    if isinstance(x, int):
        return x
    else:
        num = x.split("[")[0] # Get rid of footnotes
        if "to" in num:
            # Take the mean if it says "a to b"
            splits = num.split(" to ")
            num = (int(splits[0]) + int(splits[1]))/2
        else:
            # Get rid of words "usually" or "normally"
            num = int(num.split(" ")[0])
    return num


countries = data['Country']
leg_size = data["Lowerhouse[1]"].apply(number_parse)
pop_size = data["Population[2]"].apply(number_parse)

# List of OECD countries
# From http://www.oecd.org/about/members-and-partners/

oecd_countries = [
    "Australia",
    "Austria",
    "Belgium",
    "Canada",
    "Chile",
    "Czech Republic",
    "Denmark",
    "Estonia",
    "Finland",
    "France",
    "Germany",
    "Greece",
    "Hungary",
    "Iceland",
    "Ireland",
    "Israel",
    "Italy",
    "Japan",
    "Korea, South", # Changed from "Korea" to match Wikipedia
    "Latvia",
    "Lithuania",
    "Luxembourg",
    "Mexico",
    "Netherlands",
    "New Zealand",
    "Norway",
    "Poland",
    "Portugal",
    "Slovakia", # Changed from "Slovak Republic" to match Wikipedia
    "Slovenia",
    "Spain",
    "Sweden",
    "Switzerland",
    "Turkey",
    "United Kingdom",
    "United States"
]

# List of NATO countries
# From https://www.nato.int/cps/en/natohq/nato_countries.htm

nato_countries = [
    "Albania",
    "Belgium",
    "Bulgaria",
    "Canada",
    "Croatia",
    "Czech Republic",
    "Denmark",
    "Estonia",
    "France",
    "Germany",
    "Greece",
    "Hungary",
    "Iceland",
    "Italy",
    "Latvia",
    "Lithuania",
    "Luxembourg",
    "Montenegro",
    "Netherlands",
    "North Macedonia",
    "Norway",
    "Poland",
    "Portugal",
    "Romania",
    "Slovakia",
    "Slovenia",
    "Spain",
    "Turkey",
    "United Kingdom",
    "United States"
]

# List of European Union countries
# From https://europa.eu/european-union/about-eu/countries_en

eu_countries = [
    "Austria", "Italy",
    "Belgium", "Latvia",
    "Bulgaria", "Lithuania",
    "Croatia", "Luxembourg",
    "Cyprus", "Malta",
    "Czech Republic", "Netherlands", # Changed from "Czechia" to match Wikipedia
    "Denmark", "Poland",
    "Estonia", "Portugal",
    "Finland", "Romania",
    "France", "Slovakia",
    "Germany", "Slovenia",
    "Greece", "Spain",
    "Hungary", "Sweden",
    "Ireland"
]

# Output the parsed data to a new CSV file

newdata = pd.DataFrame({
    'Country': countries,
    'Lower house size': leg_size,
    'Population': pop_size}
)

newdata["OECD"] = newdata["Country"].apply(
    lambda x: x in oecd_countries
)

newdata["NATO"] = newdata["Country"].apply(
    lambda x: x in nato_countries
)

newdata["EU"] = newdata["Country"].apply(
    lambda x: x in eu_countries
)

newdata["OECD, NATO, or EU"] = newdata["Country"].apply(
    lambda x: (x in oecd_countries) or
        (x in nato_countries) or (x in eu_countries)
)

newdata.to_csv("Parsed_data.csv")


all_table = """
| Group of countries  | Regression[^4]               | $r^2$          | Plots         |
| :------------------ | :--------------------------- |:-------------- |:--------------|
"""

for condition in ["all", "NATO", "OECD", "EU", "OECD, NATO, or EU"]:

    # Calculate the regression
    if condition == "all":
        current_data = newdata
    else:
        current_data = newdata[newdata[condition] == True]
    log_leg_size = np.log(current_data["Lower house size"])
    log_pop_size = np.log(current_data["Population"])

    m, b, r, p, stderr = stats.linregress(log_pop_size, log_leg_size)

    def signstr(x):
        if x < 0:
            return "-"
        else:
            return "+"

    filename_str = condition.replace(" ", "_")
    filename_str = filename_str.replace(",", "")

    bracket_to_brace = lambda x: x.replace("[", "{").replace("]", "}")

    with open("regression_data_{}.txt".format(
        filename_str), "wt") as outfile:
            outfile.write("{} countries:\n".format(condition))
            outfile.write("log(n) = {:0.4f}*log(P) {} {:0.4f}\n".format(
                m, signstr(b), abs(b)))
            outfile.write("n = {:0.4f}P^{:0.4f}\n".format(np.exp(b), m))
            outfile.write("r^2 = {:0.4f}\n".format(r**2))

    regression_text = "$n = {:0.4f}P^".format(np.exp(b))
    regression_text += bracket_to_brace("[{:0.4f}]$".format(m))

    # Add to markdown table

    all_table += r"| {} | $\log(n) = {:0.4f}\log(P) {} {:0.4f}".format(
        condition, m, signstr(b), abs(b))
    all_table += r" \Rightarrow {}".format(
        regression_text[1:])
    all_table += r"| $r^2 = {:0.4f}$ |".format(r**2)
    all_table += "[linear](/leg_sizes_2020-04/legsizes_{}_linear.png) ".format(
        filename_str)
    all_table += "[log](/leg_sizes_2020-04/legsizes_{}_log.png) |\n".format(
        filename_str)

    # Make plots

    source_txt = 'Sources listed at: https://chrisphan.com/2020-04-29_what_size_are_national_legislatures/#sources'

    maxpop = max(current_data["Population"])
    maxsize = max(current_data["Lower house size"])
    minpop = min(current_data["Population"])
    minsize = min(current_data["Lower house size"])


    for scale in ["linear", "log"]:
        if scale == "linear":
            xmin = 0
            xmax = 1.1*maxpop
            ymin = 0
            ymax = 1.1*maxsize
        else:
            xmin = 10**(int(np.log(minpop)/np.log(10)))
            xmax = 10**(int(np.log(maxpop)/np.log(10) + 1))
            ymin = 10**(int(np.log(minsize)/np.log(10)))
            ymax = 10**(int(np.log(maxsize)/np.log(10) + 1))
        fig = plt.figure(figsize=(8, 6))
        ax = fig.add_subplot(111)
        if scale == "linear":
            xvals = np.arange(xmin/10**6, xmax/10**6)*10**6
        else:
            xvals = np.exp(np.arange(np.log(xmin), np.log(xmax) + 1))
        yvals = np.exp(b)*(xvals)**m
        yvals2 = xvals**(1/3)
        plt.xscale(scale)
        plt.yscale(scale)
        if scale == 'linear':
            fmtx = matplotlib.ticker.FuncFormatter(
                lambda x, f: '{:,.0f} m'.format(x/10**6))
            fmty = matplotlib.ticker.FuncFormatter(
                lambda y, f: '{:,.0f}'.format(y))
            ax.yaxis.set_major_formatter(fmty)
            ax.xaxis.set_major_formatter(fmtx)
        plt.xlim(xmin, xmax)
        plt.ylim(ymin, ymax)
        plt.plot(current_data["Population"],
            current_data["Lower house size"], "b.")
        plt.plot(xvals, yvals, 'r', label=regression_text)
        plt.plot(xvals, yvals2, 'g--', label= r'$n = \sqrt[3]{P}$')
        plt.grid(True, which="both")
        plt.legend()
        title = "Population and lower legislative house size"
        title += " ({} scale, {} countries)".format(
            scale, condition)
        plt.title(title)
        plt.xlabel("Population ($P$)\n" + source_txt)
        plt.ylabel("Lower house size ($n$)")
        plt.tight_layout()
        fig.savefig("legsizes_{}_{}.png".format(filename_str, scale))
        fig.savefig("legsizes_{}_{}.pdf".format(filename_str, scale))
        plt.close()

with open("regression_table.md", "wt") as markout:
    markout.write(all_table)
CSV file
My script produces a CSV file of the data after its processed (but before the regression is run): Parsed_data.csv
It is also shown below:
1
2
3
4
5
6
7
8
9
10
11
12
13
14
15
16
17
18
19
20
21
22
23
24
25
26
27
28
29
30
31
32
33
34
35
36
37
38
39
40
41
42
43
44
45
46
47
48
49
50
51
52
53
54
55
56
57
58
59
60
61
62
63
64
65
66
67
68
69
70
71
72
73
74
75
76
77
78
79
80
81
82
83
84
85
86
87
88
89
90
91
92
93
94
95
96
97
98
99
100
101
102
103
104
105
106
107
108
109
110
111
112
113
114
115
116
117
118
119
120
121
122
123
124
125
126
127
128
129
130
131
132
133
134
135
136
137
138
139
140
141
142
143
144
145
146
147
148
149
150
151
152
153
154
155
156
157
158
159
160
161
162
163
164
165
166
167
168
169
170
171
172
173
174
175
176
177
178
179
180
181
182
183
184
185
186
187
188
189
190
191
192
193
194
195
196
197
198
199
200
201
202
203
204
205
206
207
208
209
210
211
212
213
214
215
216
217
218
219
220
221
222
223
224
225
226
227
228
229
230
231
232
233
234
235
236
,Country,Lower house size,Population,OECD,NATO,EU,"OECD, NATO, or EU"
0,"China, People's Republic of",2980.0,1355692576,False,False,False,False
1,United Kingdom,650.0,63742977,True,True,False,True
2,Italy,630.0,61680122,True,True,True,True
3,France,577.0,66259012,True,True,True,True
4,India,545.0,1236344631,False,False,False,False
5,European Union,705.0,511434812,False,False,False,False
6,Germany,709.0,80996685,True,True,True,True
7,Japan,465.0,126451398,True,False,False,True
8,Indonesia,575.0,271407446,False,False,False,False
9,"Korea, North",687.0,24851627,False,False,False,False
10,Morocco,395.0,32987206,False,False,False,False
11,Burma (Myanmar),440.0,55746253,False,False,False,False
12,Ethiopia,547.0,96633458,False,False,False,False
13,Thailand,500.0,67741401,False,False,False,False
14,Mexico,500.0,120286655,True,False,False,True
15,Russia,450.0,142470272,False,False,False,False
16,Cuba,612.0,11047251,False,False,False,False
17,"Congo, Democratic Republic of the",500.0,77433744,False,False,False,False
18,Spain,350.0,47737941,True,True,True,True
19,Algeria,462.0,38813722,False,False,False,False
20,Brazil,513.0,202656788,False,False,False,False
21,Poland,460.0,38346279,True,True,True,True
22,Turkey,600.0,84339067,True,True,False,True
23,United States,435.0,318892103,True,True,False,True
24,Sudan,450.0,35482233,False,False,False,False
25,Vietnam,500.0,93421835,False,False,False,False
26,South Africa,400.0,48375645,False,False,False,False
27,Nigeria,360.0,177155754,False,False,False,False
28,Romania,329.0,20121641,False,True,True,True
29,Egypt,596.0,100388073,False,False,False,False
30,Ukraine,450.0,44291413,False,False,False,False
31,Pakistan,342.0,196174380,False,False,False,False
32,Kenya,349.0,45010056,False,False,False,False
33,Canada,338.0,34834841,True,True,False,True
34,Yemen,301.0,26052966,False,False,False,False
35,South Sudan,332.0,11562695,False,False,False,False
36,Uganda,375.0,35918915,False,False,False,False
37,Tanzania,357.0,49639138,False,False,False,False
38,Côte d'Ivoire,255.0,22848945,False,False,False,False
40,Zimbabwe,270.0,13771721,False,False,False,False
41,Sweden,349.0,9723809,True,False,True,True
42,Nepal,275.0,28982771,False,False,False,False
43,Argentina,257.0,43024374,False,False,False,False
44,Somalia,275.0,10428043,False,False,False,False
45,Iraq,325.0,32585692,False,False,False,False
46,Philippines,304.0,107668231,False,False,False,False
47,Bangladesh,300.0,166280712,False,False,False,False
48,Greece,300.0,10775557,True,True,True,True
49,"Korea, South",300.0,49039986,True,False,False,True
50,Malaysia,222.0,30073353,False,False,False,False
51,Iran,290.0,80840713,False,False,False,False
52,Czech Republic,200.0,10627448,True,True,True,True
53,Cameroon,180.0,23130708,False,False,False,False
54,Ghana,275.0,25758108,False,False,False,False
55,Colombia,166.0,46245297,False,False,False,False
56,Mozambique,250.0,24692144,False,False,False,False
57,Serbia,250.0,7209764,False,False,False,False
58,Syria,250.0,17951639,False,False,False,False
59,Uzbekistan,150.0,28929716,False,False,False,False
60,Switzerland,200.0,8061516,True,False,False,True
61,Austria,183.0,8223062,True,False,True,True
62,Bulgaria,240.0,6924716,False,True,True,True
63,Portugal,230.0,10813834,True,True,True,True
64,Australia,150.0,22507617,True,False,False,True
65,Ireland,166.0,4832765,True,False,True,True
66,Netherlands,150.0,16877351,True,True,True,True
67,Sri Lanka,225.0,21866445,False,False,False,False
68,Gabon,120.0,1672597,False,False,False,False
69,Belgium,150.0,11420163,True,True,True,True
70,Angola,220.0,19088106,False,False,False,False
71,Tunisia,217.0,10937521,False,False,False,False
72,Dominican Republic,183.0,10349741,False,False,False,False
73,"Congo, Republic of the",139.0,4662446,False,False,False,False
74,Jordan,150.0,7930491,False,False,False,False
75,Finland,200.0,5268799,True,False,True,True
76,Libya,200.0,6244174,False,False,False,False
77,Hungary,199.0,9919128,True,True,True,True
78,Malawi,193.0,17377468,False,False,False,False
79,Chad,188.0,11412107,False,False,False,False
80,Cambodia,123.0,15458332,False,False,False,False
81,Madagascar,151.0,23201926,False,False,False,False
82,Denmark,179.0,5569077,True,True,True,True
83,Belarus,110.0,9608058,False,False,False,False
84,Equatorial Guinea,100.0,722254,False,False,False,False
85,Norway,169.0,5147792,True,True,False,True
86,Bolivia,130.0,10631486,False,False,False,False
87,Venezuela,165.0,28868486,False,False,False,False
88,Mali,160.0,16455903,False,False,False,False
89,Chile,155.0,17574003,True,False,False,True
90,Guatemala,158.0,14647083,False,False,False,False
91,Zambia,158.0,14638505,False,False,False,False
92,Oman,84.0,3219775,False,False,False,False
94,Kazakhstan,107.0,17948816,False,False,False,False
95,Lesotho,120.0,1942008,False,False,False,False
96,Croatia,151.0,4470534,False,True,True,True
97,Eritrea,150.0,6380803,False,False,False,False
98,Georgia,150.0,4935880,False,False,False,False
99,Saudi Arabia,150.0,27345986,False,False,False,False
100,Senegal,150.0,13635927,False,False,False,False
101,Slovakia,150.0,5443583,True,True,True,True
102,Mauritania,146.0,3516806,False,False,False,False
103,Lithuania,141.0,2848000,True,True,True,True
104,Albania,140.0,3020209,False,True,False,True
105,Ecuador,137.0,15654411,False,False,False,False
106,Laos,149.0,6803699,False,False,False,False
108,Palestine,132.0,4816503,False,False,False,False
109,Peru,130.0,30147935,False,False,False,False
110,Slovenia,90.0,2070050,True,True,True,True
111,Haiti,99.0,9996731,False,False,False,False
112,Uruguay,99.0,3332972,False,False,False,False
113,Honduras,128.0,8598561,False,False,False,False
114,Lebanon,128.0,5882562,False,False,False,False
115,Burkina Faso,127.0,18365123,False,False,False,False
116,Azerbaijan,125.0,9686210,False,False,False,False
117,Paraguay,80.0,6703860,False,False,False,False
118,Turkmenistan,125.0,5171943,False,False,False,False
119,Sierra Leone,124.0,5743725,False,False,False,False
120,North Macedonia,123.0,2091719,False,True,False,True
121,Israel,120.0,7821850,True,False,False,True
122,Kosovo,120.0,1859203,False,False,False,False
123,Kyrgyzstan,120.0,5604212,False,False,False,False
124,New Zealand,120.0,4401916,True,False,False,True
125,Guinea,114.0,11474383,False,False,False,False
126,Niger,113.0,17466172,False,False,False,False
127,"China, Republic of",113.0,23359928,False,False,False,False
128,Papua New Guinea,111.0,6552730,False,False,False,False
129,Rwanda,80.0,12337138,False,False,False,False
130,Central African Republic,105.0,5277959,False,False,False,False
131,Liberia,73.0,4092310,False,False,False,False
132,Guinea-Bissau,102.0,1693398,False,False,False,False
133,Estonia,101.0,1257921,True,True,True,True
134,Moldova,101.0,3583288,False,False,False,False
135,Latvia,100.0,2165165,True,True,True,True
136,Namibia,72.0,2198406,False,False,False,False
137,Tajikistan,63.0,8051512,False,False,False,False
138,Swaziland,65.0,1419623,False,False,False,False
139,Nicaragua,92.0,5848641,False,False,False,False
140,Togo,91.0,7351374,False,False,False,False
141,Singapore,87.0,5567301,False,False,False,False
142,Maldives,85.0,393595,False,False,False,False
143,El Salvador,84.0,6125512,False,False,False,False
144,Jamaica,63.0,2930050,False,False,False,False
145,Benin,83.0,10160556,False,False,False,False
146,Montenegro,81.0,650036,False,True,False,True
147,Bahrain,40.0,1314089,False,False,False,False
148,Cyprus,80.0,1172458,False,False,True,True
149,Puerto Rico,51.0,3620897,False,False,False,False
150,Mongolia,76.0,3251587,False,False,False,False
151,Bhutan,47.0,733643,False,False,False,False
152,Cabo Verde,72.0,538535,False,False,False,False
153,Trinidad and Tobago,41.0,1223916,False,False,False,False
154,Panama,71.0,3608431,False,False,False,False
155,Hong Kong,70.0,7112688,False,False,False,False
156,Mauritius,70.0,1331155,False,False,False,False
157,Djibouti,65.0,810179,False,False,False,False
158,Guyana,65.0,735554,False,False,False,False
159,Kuwait,65.0,2742711,False,False,False,False
160,Malta,65.0,412655,False,False,True,True
161,Timor-Leste,58.5,1201542,False,False,False,False
162,Botswana,63.0,2155784,False,False,False,False
163,Iceland,63.0,317351,True,True,False,True
164,Luxembourg,60.0,520672,True,True,True,True
165,San Marino,60.0,32742,False,False,False,False
166,Jersey,58.0,96513,False,False,False,False
167,Bosnia and Herzegovina,42.0,3871643,False,False,False,False
168,Costa Rica,57.0,4755234,False,False,False,False
169,French Polynesia,57.0,280026,False,False,False,False
170,São Tomé and PrÃncipe,55.0,190428,False,False,False,False
171,"Bahamas, The",38.0,321834,False,False,False,False
172,New Caledonia,54.0,267840,False,False,False,False
173,"Gambia, The",53.0,1925527,False,False,False,False
174,Vanuatu,52.0,266937,False,False,False,False
175,Barbados,30.0,289680,False,False,False,False
176,Suriname,51.0,573311,False,False,False,False
177,Fiji,50.0,903207,False,False,False,False
178,Solomon Islands,50.0,609883,False,False,False,False
179,Samoa,49.0,196628,False,False,False,False
180,Bermuda,36.0,69839,False,False,False,False
181,Kiribati,46.0,104488,False,False,False,False
182,Guernsey,45.0,65849,False,False,False,False
183,Qatar,45.0,2123160,False,False,False,False
184,Transnistria,45.0,469000,False,False,False,False
185,Belize,31.0,340844,False,False,False,False
186,United Arab Emirates,40.0,5628805,False,False,False,False
187,American Samoa,21.0,54517,False,False,False,False
188,Isle of Man,24.0,86866,False,False,False,False
189,Abkhazia,35.0,243206,False,False,False,False
190,Antigua and Barbuda,17.0,91295,False,False,False,False
191,Seychelles,34.0,91650,False,False,False,False
192,South Ossetia,34.0,53532,False,False,False,False
193,Artsakh,33.0,150932,False,False,False,False
194,Brunei,33.0,422675,False,False,False,False
195,Comoros,33.0,766865,False,False,False,False
196,Faroe Islands,33.0,49947,False,False,False,False
197,Macau,33.0,587914,False,False,False,False
198,Marshall Islands,33.0,70983,False,False,False,False
199,Dominica,32.0,73449,False,False,False,False
200,Greenland,31.0,57728,False,False,False,False
201,Northern Mariana Islands,20.0,51483,False,False,False,False
203,Grenada,15.0,110152,False,False,False,False
204,Saint Lucia,17.0,163362,False,False,False,False
205,Tonga,26.0,106440,False,False,False,False
206,Liechtenstein,25.0,37313,False,False,False,False
207,Palau,16.0,21186,False,False,False,False
208,Cook Islands,24.0,10134,False,False,False,False
209,Monaco,24.0,30508,False,False,False,False
210,Saint Martin,23.0,31530,False,False,False,False
211,Aruba,21.0,110663,False,False,False,False
212,Cayman Islands,21.0,54914,False,False,False,False
213,Curaçao,21.0,146836,False,False,False,False
214,Saint Vincent and the Grenadines,21.0,102918,False,False,False,False
215,Niue,20.0,1190,False,False,False,False
216,Tokelau,20.0,1337,False,False,False,False
217,Wallis and Futuna,20.0,15561,False,False,False,False
218,Nauru,19.0,9488,False,False,False,False
219,Saint Barthelemy,19.0,7267,False,False,False,False
220,Saint Pierre and Miquelon,19.0,5716,False,False,False,False
221,Turks and Caicos Islands,19.0,49070,False,False,False,False
222,Gibraltar,18.0,29185,False,False,False,False
223,"Saint Helena, Ascension and Tristan da Cunha",17.0,7776,False,False,False,False
224,British Virgin Islands,15.0,32680,False,False,False,False
225,Guam,15.0,161001,False,False,False,False
226,Sint Maarten,15.0,39689,False,False,False,False
227,Tuvalu,15.0,10782,False,False,False,False
228,United States Virgin Islands,15.0,104170,False,False,False,False
229,"Micronesia, Federated States of",14.0,105681,False,False,False,False
230,Saint Kitts and Nevis,14.0,51538,False,False,False,False
231,Anguilla,11.0,16086,False,False,False,False
232,Montserrat,11.0,5215,False,False,False,False
233,Falkland Islands,10.0,2840,False,False,False,False
234,Pitcairn Islands,10.0,48,False,False,False,False
235,Christmas Island,9.0,1530,False,False,False,False
236,Norfolk Island,9.0,2210,False,False,False,False
237,Cocos (Keeling) Islands,7.0,596,False,False,False,False
238,Vatican City,7.0,842,False,False,False,False
Sources
-
Wikipedia article "List of legislatures by number of members": https://en.wikipedia.org/w/index.php?title=List_of_legislatures_by_number_of_members&oldid=951703531
-
List of NATO countries: https://www.nato.int/cps/en/natohq/nato_countries.htm
-
List of OECD countries: http://www.oecd.org/about/members-and-partners/
-
List of EU countries: https://europa.eu/european-union/about-eu/countries_en
Footnotes
-
Taagepera's argument is, basically, that a member of the legislature should spend an equal amount of energy paying attention to conversations between members (of which there are \(n(n-1)/2\)) and their own discussions with politically-interested constituents (of which there are \(kP/n - 1\), where \(k\) is the proportion of the population that cares about politics). Setting these equal and solving for $P$, we get \[P = \frac{n^3 - n^2 + 2n}{2k},\] i.e. \(n\) should be asymptotically proportional to \(\sqrt[3]{P}\). Making what Taagepera calls the "rather reasonable assumption that about one half of the population is politically active", i.e. that \(k = 1/2\), we have \(n \approx \sqrt[3]{P}\) for \(n\) sufficiently large. ↩
-
This link goes to the specific revision of the Wikipedia article that I used in my analysis. ↩
-
Natural logarithm. ↩
-
Linear regression on \(\log(n) = \alpha\log(P) + k\). ↩