
This is the first part of a three-part series of posts on generating plots of graphs with TikZ. Last year, I left my position as a mathematics professor, after teaching mathematics at the college level for 15 years (nine years as a faculty member, and six years as a graduate teaching fellow). In that time, I picked up a lot of tricks using LaTeX to produce teaching materials (handouts and slides). I decided it might be good to record some of that knowledge somewhere, and my blog seems like a natural place.
Outline
I'm planning a three-part series:
-
Part I will explain what TikZ is and why you might want to use it to produce plots for classroom use.
-
Part II will show how you can use TikZ to produce graphs for graph-reading and limit questions without having to make up functions.
-
Part III will show how I prefer to plot functions from a formula, using Python.
What is TikZ?
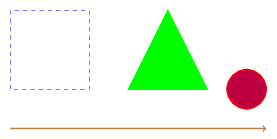
TikZ is a powerful LaTeX package for producing illustrations. TikZ is short for "TikZ ist kein Zeichenprogramm", which I understand means "TikZ is not a drawing program" in German. (Technically, TikZ comes bundled on top of another package called PGF, and the actual package is PGF/TikZ. I will refer to the package as just "TikZ" in this series of posts.) Unlike traditional illustration software such as Illustrator, in which the user would use a graphical interface create graphics, one creates graphics in TikZ with drawing commands. Here is an example of a short LaTeX document in which TikZ is used to produce a few shapes:
\documentclass[border=0.25cm]{standalone}

\usepackage{tikz}

\begin{document}
  \begin{tikzpicture}
    % Square
    \draw[dashed, blue] (0, 0) -- (0, 2)
    -- (2, 2) -- (2, 0) -- cycle;

    % Triangle
    \draw[thick, green, fill=green] (3, 0)
      -- (4, 2) -- (5, 0) -- cycle;

    % Circle
    \draw[thick, red, fill=purple]
      (6, 0) circle (0.5 cm);

    % Arrow
    \draw[->, thick, brown] (0, -1) -- (6.5, -1);

  \end{tikzpicture}
\end{document}
And here is the result:
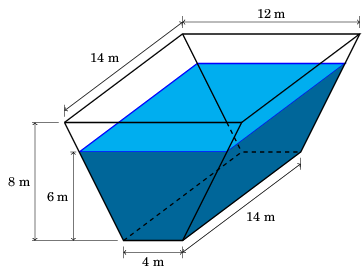
Here's an example of an illustration I created for a calculus exam, using TikZ:
You can find a number of beautiful TikZ examples on TeXample.net and on the TeX StackExchange under the "TikZ-PGF" tag.
Why use TikZ to make plots?
To be frank, creating illustrations in TikZ can sometimes be time-consuming. For example, to create the water trough illustration above, it would not be unreasonable to prefer using illustration software or drawing the diagram freehand. For plots, you can make great illustration using SageMath, Desmos, or Matplotlib. But I still sometimes prefer TikZ to create plots.
-
Complete control means plots fit the look and feel of your class: When teaching, it's important that plots have a consistent look and feel, to avoid confusing students, and to communicate expectations for their hand-drawn plots. By creating plots from scratch with TikZ allows you to have complete control over elements such as axis placement and tick mark labeling.
-
Better integration with the document: Plots created with TikZ will use the same fonts as your core document. For example, if you decide to replace
\usepackage{times}with\usepackage{fouriernc}, the plots will change too. -
It's compatible with version control: I'm a bit of a version control fanatic, and unlike scans of hand-drawn sketches of plots or screen shots from other software, TikZ code plays very well with version control.
-
Incorporate your symbols for holes and asymptotes: With TikZ, you can incorporate your graph notation for features, such as a dotted line to illustrate an asymptote, or an unfilled circle to indicate a hole.
-
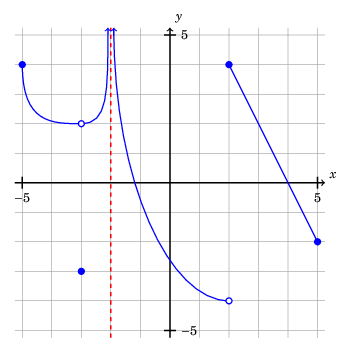
Make graphs of functions without having to actually come up with an explicit formula for the rule of the function: Sometimes it's nice to make up a function for illustration purposes without actually coming up with the formula for the rule of the function, for a problem such as:
- (2 points each) A plot of the graph of the function $f$ is below:
For each of the following expressions, either evaluate the expression or state that it is undefined:
a. \(\lim_{x \rightarrow 2^{-}} f(x)\)
b. \(\lim_{x \rightarrow 2^{+}} f(x)\)
c. \(\lim_{x \rightarrow 2} f(x)\)
d. \(f(2)\)
[. . .]
With TikZ, you can make a plot like this using features such as Bezier curves.
In the next post, I will explain how to create a plot like the one above.