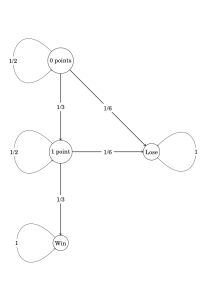
The other day, I was writing some lecture notes for my linear algebra class, and wanted to create the following diagram (to illustrate the concept of a Markov chain):

I had a very limited time in which to finish these notes. Fortunately, I found the tkz-graph package, which made this a snap:
\documentclass{standalone}
\usepackage{tikz}
\usepackage{fouriernc}
\usepackage{tkz-graph}

\begin{document}
\begin{tikzpicture}
\SetGraphUnit{5}

\Vertex[x=0, y=10]{0 points};
\Vertex[x=0, y=5]{1 point};
\Vertex[x=0, y=0]{Win};
\Vertex[x=5, y=5]{Lose};

\Edge[style ={->}, label={$1/3$}]({0 points})({1 point});
\Edge[style ={->}, label={$1/3$}]({1 point})({Win});
\Edge[style ={->}, label={$1/6$}]({0 points})({Lose});
\Edge[style ={->}, label={$1/6$}]({1 point})({Lose});

\Loop[style ={->}, label={$1/2$}, labelstyle={fill=white}]({0 points});
\Loop[style ={->}, label={$1/2$}, labelstyle={fill=white}]({1 point});
\Loop[style ={->}, label={$1$}, dir=EA, labelstyle={fill=white}]({Lose});
\Loop[style ={->}, label={$1$}, labelstyle={fill=white}]({Win});

\end{tikzpicture}
\end{document}
You don’t even have to specify the locations of the vertices; you can throw caution to the wind and have LaTeX decide where to place them! (I am a bit too much of a perfectionist for that.)
One slight issue I had was that the documentation for this package (at least on my computer, as retrieved by texdoc) was in French. Fortunately, I seem to have retained enough knowledge since I took the French language exam as a grad student that I could read most of the documentation.